Plotting#
Visualizing MESA models with mesagrid
%load_ext autoreload
%autoreload 2
from mesagrid import Track, star_plots
Updated star.py 2025-10-10 11:48:49.189137
Updated starplots.py 2025-10-10 11:48:49.192879
track = Track('work/LOGS')
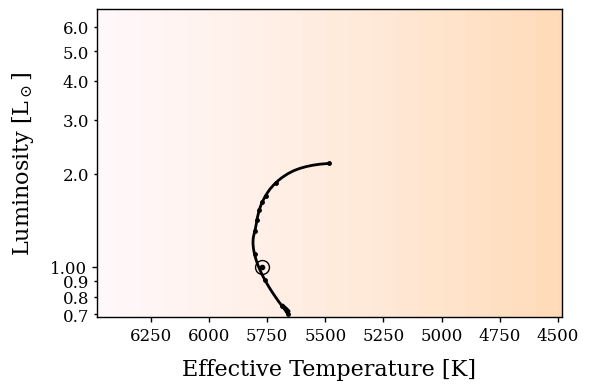
Hertzsprung-Russell Diagram#
star_plots.plot_hr(track, solar_symbol=True, show_profiles=True)
findfont: Font family ['cursive'] not found. Falling back to DejaVu Sans.
findfont: Generic family 'cursive' not found because none of the following families were found: Apple Chancery, Textile, Zapf Chancery, Sand, Script MT, Felipa, Comic Neue, Comic Sans MS, cursive
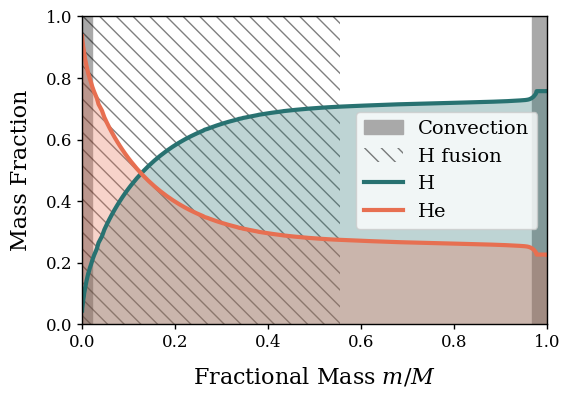
Internal chemical composition#
star_plots.plot_composition(track, 5, legend=True) # 5th profile file
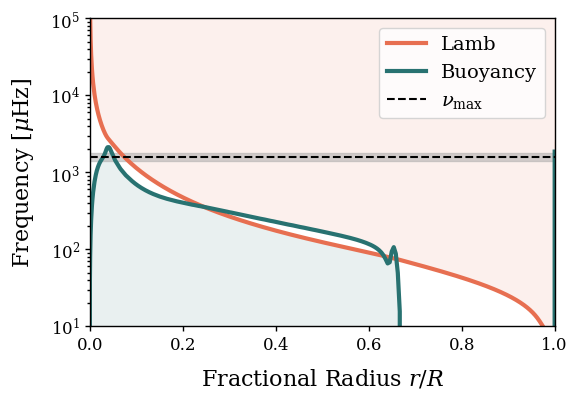
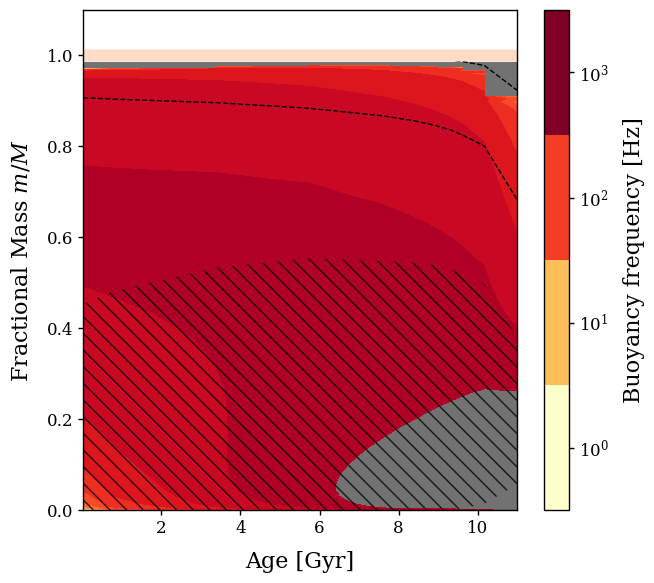
Propagation diagram#
star_plots.plot_propagation(track, 10, legend=True)
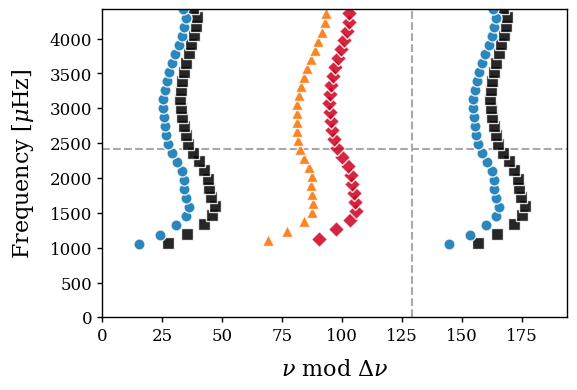
Echelle diagram#
star_plots.plot_echelle(track, 5)
Kippenhahn Diagram#
star_plots.plot_kippenhahn(track, radius_lines=[0.5, 1])
/home/docs/checkouts/readthedocs.org/user_builds/mesagrid/envs/latest/lib/python3.12/site-packages/mesagrid/star_plots.py:434: RuntimeWarning: divide by zero encountered in log10
  Z = np.array([sp.interpolate.interp1d(g.m/g.M, np.log10(g.N *  10**6/(2*np.pi)),
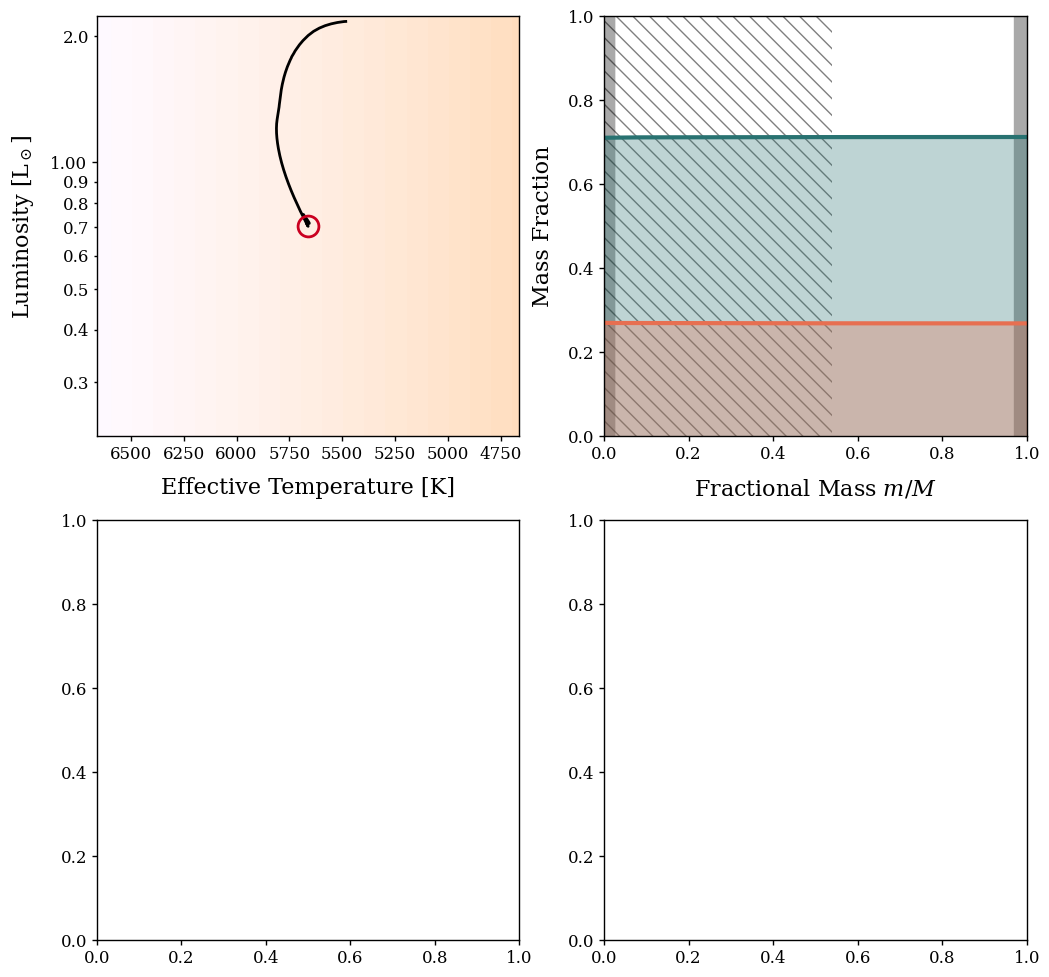
Interactive plotting#
# need to run this in a jupyter notebook for interactivity to actually work
star_plots.star_interact(track)
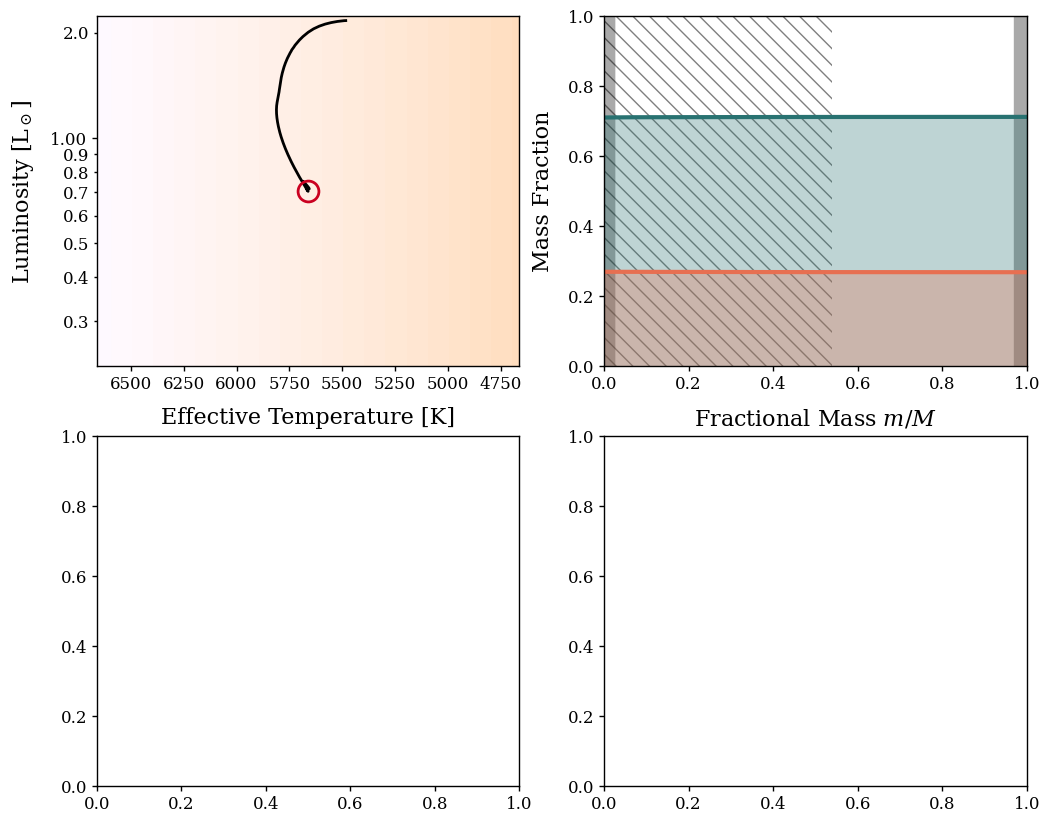
star_plots.star_interact(track, panels=[star_plots.plot_hr, star_plots.plot_composition, star_plots.plot_propagation, star_plots.plot_kippenhahn])
Pretty Plots#
star_plots.plot_convection_circles(track, 205) # cross section view of star at history row #5
---------------------------------------------------------------------------
AttributeError                            Traceback (most recent call last)
Cell In[11], line 1
----> 1 star_plots.plot_convection_circles(track, 205) # cross section view of star at history row #5

AttributeError: module 'mesagrid.star_plots' has no attribute 'plot_convection_circles'
star_plots.movie(track)
creating folder of images: ./images
Rendering frames: 100%|██████████| 11/11 [00:11<00:00, 1.00s/it]
stitching images into video starmovie.avi